
Weddings & events
What a good inquiry-to-booking rate is for a wedding venue (2026 benchmarks, and the number nobody tracks)
The published benchmark is about 20%. The benchmarks disagree with each other below that line, and the step where most venues leak, answered but never offered a tour time, is the one nobody reports.
Short answer
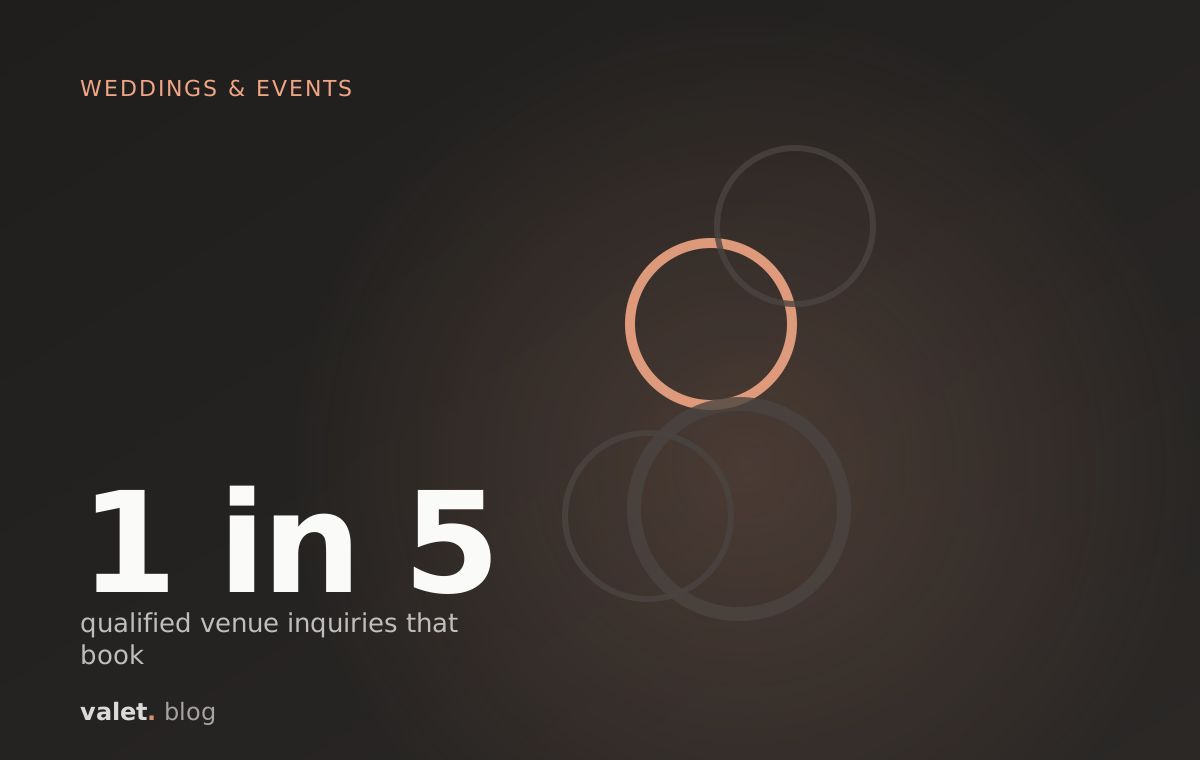
A good inquiry-to-booking rate for a wedding venue is about 1 in 5 qualified inquiries, or 20%, according to Indigo Digital's 2026 benchmarks: a venue booking 60 weddings a year needs about 300 qualified inquiries. Indigo also flags an inquiry-to-site-visit rate below 30% as a warning sign. The number almost no venue tracks sits between those two: the share of answered inquiries that were offered a real tour time.
1 in 5
qualified venue inquiries that book
Indigo Digital, August 2026
<30%
inquiry-to-site-visit rate that signals a reply problem
Indigo Digital, May 2026
$12,900
average couple spend on a reception venue
The Knot Real Weddings Study, n=10,474, 2026
A good inquiry-to-booking rate for a wedding venue is about 1 in 5 qualified inquiries. That is Indigo Digital's 2026 benchmark: a venue that wants 60 weddings a year needs about 300 qualified inquiries.1 Indigo also flags an inquiry-to-site-visit rate below 30% as a sign of slow or weak first replies.2 The number almost no venue tracks sits between those two. It is the share of answered inquiries that got a real tour time.
This is a runbook. It gives you the published benchmarks with dates, then walks you through measuring your own five-stage funnel in about three hours. Plan one sitting. You need read access to every inbox inquiries land in.
What is a good inquiry-to-booking rate for a wedding venue in 2026?#
The 2026 benchmark for wedding venues is about 20% of qualified inquiries booking. Below that headline, the published numbers come from different sources, in different years, measured different ways. Read them as a set, with dates.
| Stage | Figure | Source, date | Type |
|---|---|---|---|
| Qualified inquiry → booking | About 1 in 5 (20%); 300 inquiries for 60 weddings | Indigo Digital, 3 Aug 2026 | Agency benchmark |
| Inquiry → site visit | Below 30% "signals problems with response speed or first-reply quality" | Indigo Digital, 12 May 2026 | Agency threshold |
| Tour booked → tour held (show rate) | 70–85% called "healthy" | Everbridal, 11 Jan 2022 | Vendor blog, worked example |
| Tour → booking | 40%, used as an example | Everbridal, 11 Jan 2022 | Vendor blog, worked example |
| Venues toured per couple | Three to five | Dual Spark, 12 Jan 2026 | Agency observation |
| Response goal | Every lead within 30 minutes | Tripleseat 2026 report | Platform guidance |
| Answered → offered a tour time | Not published | None | Gap |
Sources: Indigo12; Everbridal3; Tripleseat4; Dual Spark5.
Run the numbers through and they do not agree. Start at 300 qualified inquiries. Send 30% to a tour: 90 tours. Hold 70–85% of them: 63 to 77 tours. Book 40%: 25 to 31 weddings. Indigo's 1 in 5 says 60. The stage figures produce about half the headline.
Do not average them. The gap tells you two things. Nobody has measured the full venue funnel in one dataset. And the stage most likely to explain the gap, answered but never offered a time, is the one with no published number. Indigo says median first response time is "the metric most directly correlated with site visit rate, and the one most venues have never measured."2 Outside weddings, Pied Piper's 2026 study of 3,211 home-services inquiries found only 28% were offered a time.8 That is a different industry. It is still the closest measured figure.
Use this runbook if, and do not use it if#
This runbook fits a venue that books weddings from written inquiries and wants its own funnel numbers.
- Use it if you take inquiries by email, website form or listing sites, you book tours, and you can name your booking count for the last 12 months.
- Use it if your inquiry-to-tour rate feels low and you cannot say why.
- Do not use it if you have fewer than 30 inquiries in the window. The rates will swing too much to act on. Widen the window first.
- Do not use it if most of your bookings start by phone. Phone calls need a call log, and this runbook counts written threads.
Prerequisites before you count anything#
Gather the prerequisites first. A missing inbox is the most common reason the counts come out wrong.
- Inbox access. Read access to every address inquiries reach: info@, bookings@, the owner's personal address if couples use it.
- Listing accounts. Logins for each directory or marketplace that sends you leads, so you can see leads that never reached email.
- Calendar. The calendar that holds tours, with no-shows marked if you mark them.
- Contracts list. Signed contracts for the window, with the date of first inquiry if you have it.
- A written definition of "qualified." For example: a date in a season you sell, a guest count inside your limits, and a real name. Write it down before you start. Do not change it mid-count.
Pick a 12-month window. Indigo advises comparing year on year, because engagement-season weeks carry a disproportionate share of annual volume.1 A 90-day window in January will not match a 90-day window in July.
How to measure your funnel, step by step#
Measuring your funnel takes five steps. Each one ends with a verification. Do not move on until it passes.
- List every inquiry. Pull form notifications, listing-site lead emails and direct emails from the window into one sheet. One row per couple, not per message. Verify: your row count is higher than your booking count by at least four times. If it is not, an inbox or listing account is missing. Go back to prerequisites.
- Mark qualified. Apply your written definition to each row. Verify: spam and vendor pitches are out, and a second reader would mark the same rows. If you hesitate on more than one row in ten, tighten the definition and restart this step.
- Mark answered. A row counts as answered only if a person or assistant replied to what the couple asked. An auto-confirmation does not count. Verify: open five random "answered" rows and read the reply. If any is only an auto-reply, recheck every row.
- Mark offered a time. A row counts only if a reply named a specific tour date and time, or held one. "Let us know when you would like to visit" does not count. Verify: each row you marked has a date and time you can quote.
- Mark toured and booked. Match calendar entries and contracts to rows. Mark no-shows separately from tours held. Verify: your booked count equals your contract count for couples who first wrote in the window. If not, find the bookings that came in by phone or in person and note them outside the funnel.
Now compute the rates. Each one divides a stage by the stage before it. The worksheet below holds the formulas and the published benchmark beside each line.
| Stage | Your count | Rate formula | Published benchmark |
|---|---|---|---|
| A. Qualified inquiries | ___ | n/a | 300 for 60 bookings (Indigo 2026) |
| B. Answered (real reply) | ___ | B ÷ A | Not published for venues |
| C. Offered a specific tour time | ___ | C ÷ B | Not published (the gap) |
| D. Tour held | ___ | D ÷ A | Warning below 30% (Indigo 2026) |
| E. No-shows | ___ | D ÷ (D + E) = show rate | 70–85% (Everbridal 2022, illustrative) |
| F. Booked | ___ | F ÷ D = tour-to-book; F ÷ A = overall | 40% (Everbridal, example); 20% overall (Indigo 2026) |
| G. Answered once, no follow-up, no tour | ___ | G ÷ B | Your leak rate; compare next year |
| H. Lost with a reason logged | ___ | H ÷ (A − F) | Target: every lost row has a reason |
Read row C first. If fewer than half of answered couples were offered a time, the middle of your funnel is where bookings leak. Then read row G. That is the pile the Lost Lead Audit calls "answered once and dropped."
What one point of booking rate is worth#
One point of booking rate is worth about three weddings for a venue at Indigo's 300-inquiry scale. The Knot's 2026 Real Weddings Study, drawn from 10,474 couples, puts average reception venue spend at $12,900.6 Run the math:
- 300 qualified inquiries × 20% = 60 bookings × $12,900 = $774,000 a year.
- Each extra point: 300 × 1% = 3 bookings × $12,900 = $38,700.
Use your own average booking, not the national figure, when you can. MMCG reports a wide spread, from $3,000 to $8,000 for space-only rental to $25,000 and up for all-inclusive luxury.7
Three failure modes, and the exact fixes#
Three failure modes break most first attempts at this count. Check for each before you trust a rate.
Failure 1: auto-replies counted as answers#
Auto-replies counted as answers inflate row B and hide the leak. Listing sites and form tools often send an instant "thanks, we'll be in touch." Symptom: your answered rate is close to 100%, but your tour rate is under 30%. Fix: reopen every answered row and keep only replies that address the couple's question. Expect row B to drop. That drop is the finding.
Failure 2: one couple counted three times#
One couple counted three times shrinks every rate. Couples often write through a listing site, then your form, then your address. Symptom: row A is much larger than you expected, and your overall rate looks far below 20%. Fix: merge rows on couple name, wedding date and email. Keep the earliest date as the inquiry date. Rerun every rate.
Failure 3: comparing a season to a season#
Comparing a January quarter to a summer quarter mixes volume with performance. Engagement-season weeks carry more volume,1 and May to November carries the weddings themselves (69% of them, per MMCG).7 Symptom: rates swing 10 points between quarters with no change in process. Fix: compare the same window year on year. If you only have one year, report the 12-month total and nothing narrower.
Rollback and health check#
Roll back to step 1 if your booked count does not reconcile with your contracts after fixing the three failures. Something is missing from the inbox list. When the counts do reconcile, run one health check. Pick ten random lost rows and read the full thread. If more than three end with your reply unanswered and no second message, your rate problem is follow-through, not lead quality. A thread in r/WeddingPhotography (170+ comments, roughly three years old) described couples as "slow to sign contracts, slow to respond." If your threads show the same thing, it argues for a second and third message, not for fewer inquiries. See why couples ghost after pricing and venue tour no-shows for the messages.
How we got this: benchmark figures are from the dated sources in the table. Valet does not yet publish a funnel benchmark of its own. Valet has not published this figure; it is something Valet could measure from free lead checks, with owners' consent.
Where Valet fits#
Valet is an AI assistant for a venue's written inquiries: email to your own address, website forms, listing-site lead emails and your free Valet page. It answers from your facts sheet, offers real tour times from your calendar and holds them, and follows up at most twice by default. Each inquiry carries one of the Valet Inquiry States (New, Answered, Time held, Followed up, Booked, or closed with a reason). So rows B, C, G and H of the worksheet fill themselves. Discounts and contracts wait for you, and every reply says it is AI.
To get your own numbers without the three-hour count, start with the free lead check. Forward 10 to 20 recent inquiries and see what went unanswered, what stopped after one reply, and what it was worth.
Questions people ask
What is a good inquiry-to-booking rate for a wedding venue?
About 20%, or 1 in 5 qualified inquiries, according to Indigo Digital's 2026 venue benchmarks. The figure applies to qualified inquiries, so count only couples with a plausible date, guest count and budget before comparing.
What is a good tour-to-booking rate for a wedding venue?
The most-quoted figure is 40%, but it comes from a worked example on a venue-software vendor's blog (Everbridal, 2022), not from a measured study. Use it as a placeholder until you have twelve months of your own tour and booking counts.
How many inquiries does a wedding venue need?
Divide your booking target by your booking rate. At Indigo's 1-in-5 rate, 60 weddings a year need about 300 qualified inquiries. If your own rate is lower, the answer is more inquiries or a better middle of the funnel, and the middle is usually cheaper.
What is the metric most venues don't track?
The share of answered inquiries that were offered a specific tour time. Indigo says first response time is the metric most correlated with site visits and the one most venues have never measured; the offered-a-time rate is the step after it, and nobody publishes it.
Sources
Confidence: H primary source checked · M credible secondary or reported · L vendor claim or single report. Reddit and forum items are quoted from public threads and summarised, not endorsed.
- Wedding venue lead benchmarks guide · Indigo Digital · 2026-08-03 M
- Venue enquiry funnel metrics that matter · Indigo Digital · 2026-05-12 M
- Wedding venue show rate improvement · Everbridal · 2022-01-11 L
- The 2026 Event Intelligence Report: Data, Benchmarks, and Blueprints for High Growth Venues · Tripleseat · 2026 M
- Why couples aren't booking after the tour (and what to do about it) · Dual Spark Marketing · 2026-01-12 L
- Average wedding vendor costs (Real Weddings Study 2026, n=10,474) · The Knot · 2026-09-29 H
- The U.S. wedding venue market: an investment thesis for 2026-2030 · MMCG Invest · 2026-08-14 M
- Precision Garage Door Ranked #1 in Customer Lead Handling Effectiveness Home Services Study (Pied Piper PSI 2026) · BusinessWire / Pied Piper Management Company · 2026-04-12 H
How to cite this page
Cite this page
Valet, "What a good inquiry-to-booking rate is for a wedding venue (2026 benchmarks, and the number nobody tracks)", valet.team, October 2026.
Keep reading
 Weddings & eventsWhy couples ghost after you send pricing, and what the second message should sayThe usual answers are price, a hidden price list, or a slow reply. The bigger leak is that most vendors send one reply and stop, while the couple is still choosing between five of you.Strategy desk · 12 min · 1 October 2026
 Weddings & events"Our leads from The Knot / WeddingWire never respond": ghost leads, fake leads, or leads nobody followed up?Vendors say the leads are fake. The Knot says they are templated and ghosted. A U.S. senator has asked the FTC to look. None of them has published what happened to each inquiry, and that is the only record that settles it for your listing.Policy desk · 10 min · 1 October 2026
 Weddings & eventsHow many times should you follow up with a couple who hasn't replied? (And when the lead is dead)Wedding advice runs from "one more time than you are now" to "as many times as it takes". Nobody says when to stop. Here is a stop rule, a list of lost reasons, and the three messages that sit between the first reply and the end.People at work · 11 min · 1 October 2026